Communicating Can Be Done in So. Many. Ways.
Accounting firms deal in complexity every day. Regulations, timelines, processes, and data-heavy reports are second nature internally, but for clients, they can feel intimidating and overwhelming. Clear communication isn’t just a nice-to-have; it’s essential to building trust, confidence, and long-term relationships.
This three-part series explores how thoughtful design helps accounting firms translate complex information into clear, accessible, and engaging content—without sacrificing accuracy or professionalism.
Making the Complex Clear: Infographics Simplify
Accounting is full of numbers, processes, and regulations that can overwhelm clients. Infographics take the complex and make it visual and builds confidence and clarity by showing, not just telling.
Clients don’t need to understand every technical detail to feel informed. They need clear takeaways, logical flow, and reassurance that they’re in capable hands. Infographics bridge that gap.
Why Infographics Work
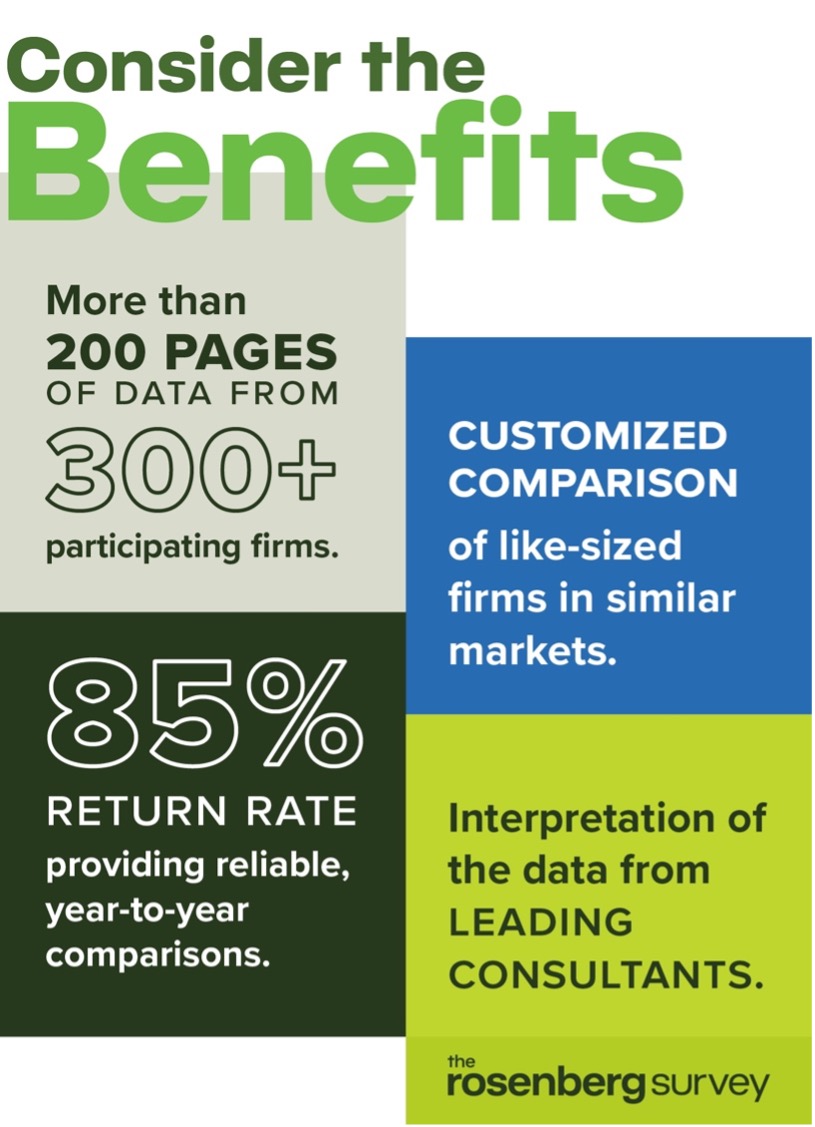
Visual information is processed faster and remembered longer than text alone. A well-designed chart, timeline, or diagram can quickly explain concepts like tax deadlines, audit phases, or service offerings without requiring clients to read dense paragraphs.
Infographics also reduce friction. Instead of fielding the same questions repeatedly, firms can proactively answer them in a way that’s easy to digest and easy to share.

Built for Multi-Channel Use
One of the biggest advantages of infographics is their versatility. A single visual can be adapted across multiple platforms, including:
- Brochures and marketing one-pagers
- Blog posts and educational resources
- Website pages explaining services or processes
- Social media posts that highlight key takeaways
- Email newsletters and one-off e-blasts
This makes infographics a high-value asset that supports both client education and marketing efforts.
Common Uses for Accounting Firms
Infographics are especially effective for:
- Explaining filing deadlines and seasonal timelines
- Showing step-by-step processes, such as onboarding or audits
- Breaking down service tiers or engagement models
- Visualizing workflows, responsibilities, or compliance requirements
These visuals help clients understand not just what you do, but how you do it.
Design Best Practices
Effective infographics balance clarity with professionalism:
- Use hierarchy through headlines, subheads, icons, and spacing to guide the reader’s eye
- Keep text concise—visuals should do most of the heavy lifting
- Stick to a color palette and typography that aligns with your firm’s brand to reinforce credibility
The goal is not decoration, but communication.
Infographics Builds Trust
Well-designed infographics don’t just educate clients; they build trust. Consider how you can turn your firm’s most frequently asked questions into simple, visual answers that work harder for your business.
Stay tuned for part two!